

My Comments: Like everyone, I could use a crystal ball. Since they don’t exist, I have to turn to writers with a far better understanding of what’s going on than I have. To that end, these words from Larry Fuller are helpful. Fortunately, he avoids many of the big words that too many pundits use.
If you have money invested, or currently pulled out of the markets, I encourage you to read his words, and if you want to see the many charts he provides, a link to the article is at the end of this post.
I find the comment section at the end of his article helpful as well. I also like the idea of exposing 35% of your money to SPY with the rest in cash. Or indexed annuities where your downside is protected and your upside unlimited. If you’re relying on me to help you, call or email me and we’ll talk about it.
by Lawrence Fuller \ Jan 18 2019
What Woke The Bear?
It might appear as though the initial catalyst to the rapid decline in stock prices that began last October was the spike in the 10-year Treasury yield to 3.25%, which is a level we haven’t seen since 2011. This was followed by an escalation in trade tensions between the US and China, Chairman Powell’s hawkish commentary regarding interest rate policy, and the government shutdown.
These are obviously headwinds to economic growth and higher stock prices, but I don’t believe any of them to be the root cause of the broad decline in risk assets. I will call them accelerators. There is a far more significant force that is having a gravitational pull downward on financial asset prices. That force is liquidity.
Every year there are asset classes that win and lose, which is why we diversify our portfolios across several of them, but last year nearly every asset class posted a negative return. Why? The only logical explanation is that central banks began to unwind ten years of easy money policies by draining liquidity from the global financial system through quantitative tightening (QT). This is akin to pulling the drain plug in a bathtub full of water, and as the water level falls so do all the toy boats floating on the surface.
By the fourth quarter of 2017, the Fed had stopped increasing the size of its balance sheet with asset purchases (QE), but the Bank of Japan (BOJ) and the European Central Bank (ECB) were increasing the size of theirs by a collective $100 billion per month.
The Fed was the first central bank to pull the drain plug more than a year ago, as can be seen below, by reducing the size of its balance through quantitative tightening or selling the bonds on its balance sheet. It was also raising short-term interest rates, which reduces liquidity.
As a result, by the fourth quarter of 2018, the amount of global liquidity being added each month fell from $100 billion to zero on a net basis. It was scheduled to decline by $20 billion per month in the current quarter based upon central bank guidance.
How do we explain the synchronized and robust rally in global stock markets that we have seen since the start of the year? It appears that Mario Draghi deviated from the ECB’s plan to cease bond purchases at year-end, likely due to the uncertainty over Brexit outcomes, and he increased the central bank’s purchases of sovereign and corporate debt. I think this has something to do with the rally, as more liquidity means higher financial asset prices.
Investors will conjecture about whether the US and global economy will strengthen or weaken this year. They will scrutinize corporate earnings and debate the merits of the pending trade deal with China. They will listen intently to what Fed governors have to say about monetary policy. Yet I suspect the single most important factor in market performance moving forward is what central banks, led by the Fed, do with their balance sheets. The correlation between the liquidity supplied by central banks and stock market performance is undeniably strong, as can be seen below.
In fact, I think it is possible for the economic fundamentals to strengthen moving forward and still see stock prices decline if central banks resume draining liquidity from the global financial system. We saw several periods over the past decade when the economic fundamentals deteriorated dramatically, including a corporate profits recession in 2016, yet all it did was temporarily slow the steady rise in the S&P 500 index. The liquidity being added to markets through quantitative easing overwhelmed the influence any negative fundamental developments had when it came to valuations. This was Ben Bernanke’s intent at the earliest stages of the recovery from the Great Recession in 2009.
The Fed wanted to drive down interest rates with its purchases of Treasuries and mortgage-backed securities to lower borrowing costs and the yields investors were earning on the most conservative financial instruments. This would force investors to take more risk, reaching further and further out on the risk spectrum for yield. As risk asset prices rose across the board, it would lead to a wealth effect that would increase the rate of consumer spending on goods and services. Other central banks followed suit in the years that followed. While some may deem it to have been a success, I think it is far too early to judge. I want to see what transpires after we have scaled down the backside of the mountain of liquidity depicted above. I’m calling it the Great Unwind.
The Downside Of QE
I have had one major criticism of Fed policy over the past five years. Its initial quantitative easing program (QE1) was sold as a crisis-level policy designed to stem the deflationary spiral in financial asset prices that was underway at the depths of the Great Recession. It was a brilliant move by Chairman Bernanke. Yet what was sold as a defibrillator turned into IV therapy, as the sudden jolt of liquidity-driven demand for financial assets turned into a steady drip paired with near-zero-percent interest rates year after year. As a result, we have become addicted.
Historically, stock and bond prices have been gauges of what investors expect to happen in the economy, while interest rates price risk. They all serve as discounting mechanisms to varying degrees. The Fed turned these mechanisms into catalysts in order to achieve its objectives, and in doing so for such a long period of time, it has led to a gross mispricing of nearly all financial assets. This is a global issue, but it is the most pronounced in the US.
What would a free market be telling us today? I have no clue other than to suspect that valuations would be substantially lower and interest rates would be substantially higher as you graduate to higher-risk securities. This brings me to the downside of quantitative easing, which is how do you stop feeding the financial system its medicinal drip of liquidity, much less withdrawing it, without reversing the wealth effect that it was intended to create? I don’t think it is possible. Making matters worse today is that even after a near bear-market decline in the S&P 500, stocks are still extremely expensive on a historical basis.
Valuations
Some might point to excessive valuations as another reason for the stock market’s recent decline, but we know that historically high valuations are not the underlying cause of the end bull markets. They do have a lot to do with the magnitude of the declines, as there is always a reversion to the mean. The decline that began last October has reinvigorated strategists on Wall Street, who practically all now have bullish outlooks for 2019. Those that were bearish believe that the decline in stock prices has created enough margin of safety to be more aggressive. I think they need to remove the IV catheters from their veins.
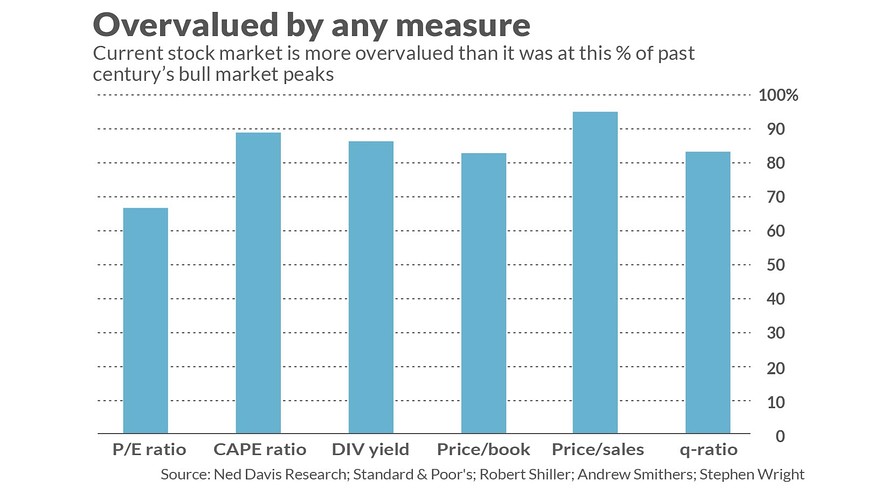
Mark Hulbert recently compared six widely used valuation indicators to show that even after a near 20% decline in the S&P 500, the stock market is still valued higher than what it was at between 67% and 95% of 36 previous market tops.
Remember that liquidity drives markets, and there is no other force more influential. If central banks continue the path of withdrawing it, I expect there will be a steady and substantial reversion to the mean, which means lower valuations. It also means higher interest rates on higher risk assets, which will have significant implications for investors hunting for yield.
My Outlook
I think it is impossible to have any certainty in an outlook for markets when you believe that their direction is dependent on whether central banks add or withdraw liquidity on a net basis. Therefore, I am implementing an investment strategy that is preparing for the worst, while still positioning to participate in a recovery to new all-time highs. My suspicion is that liquidity will continue to be withdrawn as 2019 progresses, and this will serve as the overarching headwind to higher valuations.
The Fed has painted itself into a corner. If the economic fundamentals don’t deteriorate, it will likely continue withdrawing $50 billion per month in liquidity, which will depress financial asset prices and undermine the wealth effect that has been the foundation of this expansion. If the fundamentals do deteriorate, depending on the severity, how much liquidity will need to be added to maintain current valuations? Additionally, at what point does the Fed lose credibility?
Yesterday government officials cajoled the market with the suggestion that tariffs might be eliminated to reach an agreement with China on trade. Stock prices look to open higher this morning on that expectation. Let’s assume that next week the trade dispute is resolved, the government reopens for business and corporate earnings meet expectations. This will probably be enough good news to drive the stock market back above its 200-day moving average at approximately 2,740 in the near term.
Yet I don’t believe there will be enough good news to countervail a continuation of quantitative tightening by global central banks, should it resume in earnest in the months ahead.
The Portfolio Architect is a Marketplace service designed to optimize portfolio returns through a disciplined portfolio construction and management process that focuses on risk management. If you would like to see how I have put my investment strategy to work in model portfolios for stocks, bonds and commodities, then please consider a 2-week free trial of The Portfolio Architect.
