

 My Comments: Will stock prices plummet? Maybe…
The Ratio That Predicted The 2001 And 2008 Stock Market Crashes Is Again Flashing Red
by Atle Willems, May 4, 2017
The co-movement of the stock market and the money supply to saving ratio has been obvious especially in recent decades.
But the two have now dislocated with stocks still climbing though the ratio has plummeted.
This should be worrying for stock market investors since stocks crashed following the peaks in the money supply to saving ratio in ’01 and ’08.
Savings are paramount for economic growth. Frequently ignored these days is the principle that an adequate amount of savings also helps promote economic stability. Since money is created as debt under the current monetary system, changes in the money supply relative to saving can therefore serve as an indicator of the degree of economic risk present in an economy.
As is well-known among economists, the economic costs of monetary inflation are wide-ranging and include price inflation and distortions, over-consumption and mal-investments. Combined, these costs lead to lower economic growth and, in some cases, poverty. They also contribute to economic instability.
Enter the money supply to saving ratio (MS/S), a ratio based on an insight F.A. Hayek first offered generations ago and which I outlined some weeks back. In short, the higher the MS/S ratio the potentially greater the economic distortions and the higher the risk of boom and bust cycles. The ratio is therefore closely related to The Austrian Theory of The Business Cycle.
Following a period of expansion, the MS/S ratio must at some stage eventually drop. An inflating money supply will ultimately produce intolerable levels of price inflation. Alternatively, banks will eventually cut back lending as delinquency and default rates increase (which may trigger a banking crisis). The latter has been the biggest problem during the last couple of decades.
As for the denominator in the ratio (saving), people will increase the proportion of income saved when uncertainty increases. This may take place in tandem with, or even be induced by, a declining money supply growth rate. Saving preferences, especially increases, can change substantially quicker and more violently than the money supply.
As economic and stock market corrections are closely related (as both react to changes in the elastic money issued by banks), the chart below reveals how peaks in the MS/S ratio for the U.S. economy were associated with the onsets of the 2000/1 and 2007/8 stock market corrections.
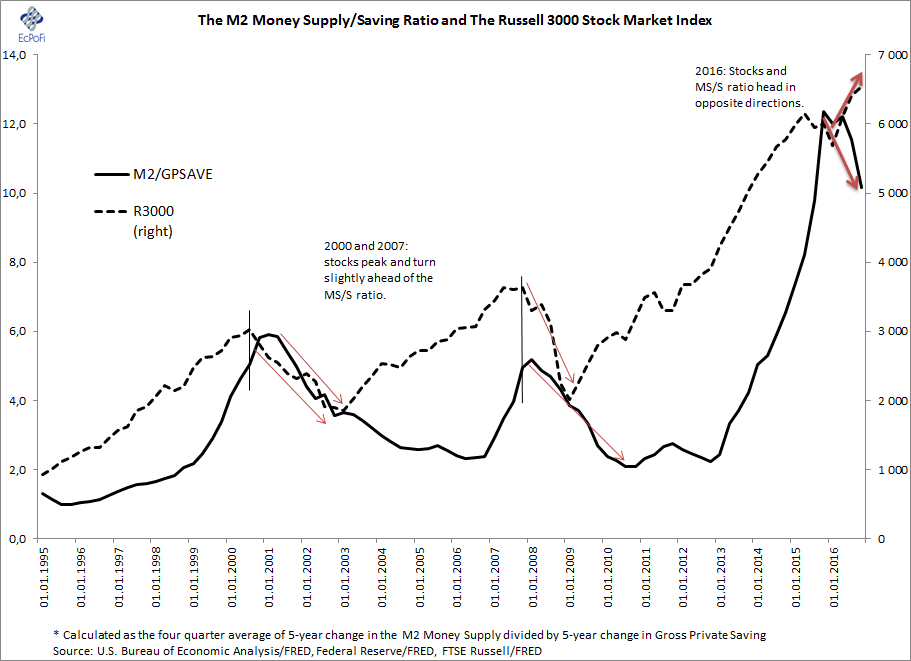
The chart also reveals how stocks turned slightly ahead of the MS/S ratio before the prior two downturns and that peaks in the ratio were associated with stock market losses. The table below depicts the annualized price changes in the Russell 3000 stock market index for four different time periods following the 2001 and 2008 peaks in the MS/S ratio.

For example, the table shows that stocks depreciated 10.9% on an annualized basis over the 6 month period following the Q1 2008 peak in the MS/S ratio and 41.2% during the first 12 months.
But the chart also shows this: stocks and the ratio departed in the second quarter last year with the two heading in opposite directions. Based on the 2001 and 2008 outcomes and the fact that stocks have again appreciated in recent months, these developments could be troubling for stock market long positions going forward.
Though the chart shows an initial decline from peaks actually did mark the end of the 2001 and 2008 upward swings, successfully timing peaks in the ratio must be assumed to be more luck than science.
In general however, the higher the MS/S ratio and the longer it remains elevated, the greater the probability of an economic reaction and hence the greater the chances stocks will perform badly. It could therefore prove to be a wise move to gradually decrease the allocation to stocks proportionally with increases in the ratio. For those more concerned with capital preservation than squeezing out a few more percentage points returns from a fading bull market, it could prove wise to dispose of all stocks once the MS/S ratio has turned downward. For aggressive speculators, this might even prove an opportune time to go short.
Based on the above observations and the theory underpinning the MS/S ratio, it would not be unreasonable to be prepared for further declines in the ratio from the 2016 peak and another financial crisis. As the ratio has already contracted for two consecutive quarters since the record peak in Q2 last year, it also would not be unreasonable to expect stocks to soon plummet once again.
