

My Comments: I’m not a prophet of doom. Never have been and haven’t changed my spots. But I am a realist when it comes to investing in the markets. I’ve been in cash since March and missed most of the 3 month rally since then. Disappointing but…
Some readers of these blog posts have laughed at me and suggested it was different this time. And maybe it is, but I doubt it. The challenge is to remain patient and know that a correction will arrive.
Some of the focus has to be how old you are and where you are with respect to retirement and the need to extract an income from your invested money. If you have a solid workplace environment and your day to day needs are met by some form of paycheck, you can run the cards as hard as you like and in the long run, it may not make any difference.
But for those of us no longer employed and having no income flowing into our bread and butter bank accounts, it’s another matter. These words from Bert Dohmen make sense to me. I hope they’re not too technical for you.
by Mark Dohmen \ JUL 29, 2020 \ https://tinyurl.com/y25w8vt5
With the big rush into the hot tech stocks since March 23, the NASDAQ index has risen to new record highs.
However, the majority of the stocks within the NASDAQ have actually been declining during the past several weeks.
There are a growing number of striking parallels between the current market environment and the environment we were in five months ago.
Most analysts say the markets have continued to rise higher over the past 4 months. But what if we told you the REAL bear market rally top may have already happened, about seven weeks ago?
You see, most inexperienced investors focus on the most speculative part of the market – namely, tech stocks, listed on the NASDAQ. These inexperienced investors have been buying like crazy in order to get in for what they think is the next big up-move.
This may explain why there are a number of warning signals we’re seeing in the NASDAQ lately. While the index has continued to rise, the vast majority of its underlying stocks have been declining. This is eerily similar to what happened in January ahead of the February market crash.
At that time, we correctly gave a warning, keeping our valued members safe, while investors lost over $6 trillion of stock value in 4 short weeks.
With the big rush into the hot tech stocks since March 23, the NASDAQ index has risen to new record highs. The five or so big popular stocks discussed all day in the financial media are also trading at record highs.
However, the majority of the stocks within the NASDAQ have actually been declining during the past several weeks, as can be seen in the chart below.
This happened in mid-January as well, just one month before the historic market crash:
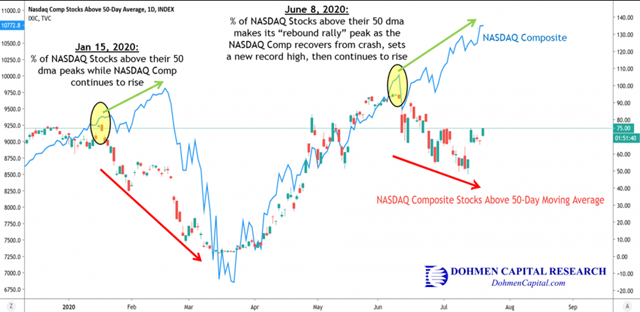
You can see the percent of NASDAQ stocks above their 50-day moving average originally peaked on January 15, about one month ahead of the top in the NASDAQ.
More recently, the percent of NASDAQ stocks above their 50-day moving average made another peak on June 8, the same day the NASDAQ Composite set a new record high after recovering from the crash.
In both periods, NASDAQ stocks started to decline (red arrows) while the actual price of the NASDAQ Composite continued to rise (green arrows).
Looking at the above chart and reading what our analysis shows, would you think it’s a great time to buy (or hold) the big tech stocks… or sell?
In May 2020, we discussed the signals we saw leading up to the historic market crash in late February.
The major indices, mainstream media, and conventional Wall Street “wisdom” had created a perfect storm, leading many ill-advised investors to financial ruin in the largest engineered market crash we’ve ever seen.
And yet, despite the big “recovery rally” from the March lows, markets seem poised yet again for a second disaster. A key component of our analysis is our wide array of proprietary technical indicators. We also use sentiment indicators, which we use to identify trends in human behavior and emotions.
These are probably the most important factors influencing economic and financial market trends, at least according to the Elliott Wave theory. Contrary to accepted thought, fundamentals are the “effect,” while human emotions are the “cause.”
You don’t hear that in the financial media. But it explains how we can have record speculative periods in the markets as the past several months, with valuation at extremes that don’t make sense, while some indices are still going higher. Emotions are the driving power, not earnings, dividends, or other fundamental measures.
That is why such periods repeat near important market tops, although the stock names change. The constant is “human emotions.”
There are a growing number of striking parallels between the current market environment and the environment we were in five months ago. Back in February, one of the telltale signs that markets were due for serious trouble was a widening divergence between the widely followed major indices, like the DJI and S&P 500, and much broader, more representative measures of the market that include many more stocks.
In particular, we noticed divergent behavior between the S&P 500 and the VALUG index, which is our favorite broad measure of what the majority of stocks are actually doing. The VALUG not only incorporates over 3 times as many stocks as the S&P 500, but it is also price-weighted (not cap-weighted like the S&P). Therefore, the VALUG is not artificially skewed by five or so mega-cap companies outperforming the majority of their peers, which is what’s happening in the S&P.
In the wake of the recent rally in stocks, let’s take a look at the divergence between the two indices now: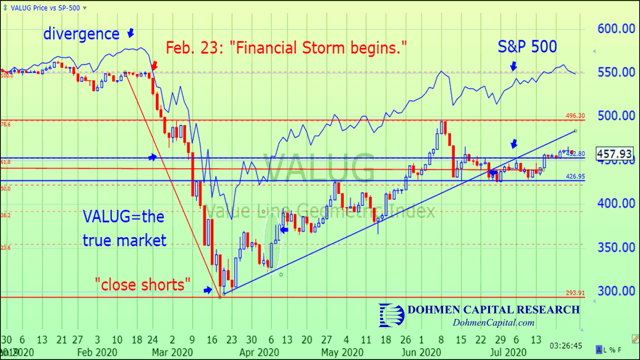
Here, we see that the divergence between the VALUG (candlesticks) and the S&P 500 (blue line) is now much greater than it was at the February top. This suggests that the impending decline may, in fact, be even more severe than the plunge we saw in February and March.
It is vital to any investor to understand the important underlying factors that led up to the market crash we saw earlier this year. The same warning signals we saw in mid to late January are eerily similar to the ones we’re seeing currently in the markets.

Who has laughed at you and suggested that it’s different this time? I have chided you specifically because it’s NOT different this time.
You often say how long you’ve been studying the markets…..and yet, you have missed the largest rally in your lifetime/nay, ever. After 45 years?
Let me sum up the one lesson that it only took me 20 years to learn that you have not yet learned after 45 years…….and I’m going to do it in one sentence: HUMAN NATURE IS A FAILED INVESTOR.
A good advisor educates his clients that they get paid to sit through the volatility of equities. That’s specifically why they pay more (and in fact, they are the best invention in human history to exceed inflation).
It’s really quite simple. Stocks drop, on average, 30% every five years…..and have done so 14 times since WW2. Sometimes more, sometimes less. So…if you have a million dollars, you can determine how much you can watch your balance fall from time to time…..and allocate accordingly. 60/40? 50-50? 40-60?
Emotional strength wins. You rebalance when you get a Kohl’s coupon in the mail for 30% off stocks…..but it takes emotional strength, and an advisor who charges 1-2% per year to guide you as a fiduciary is many times what he or she charges you.
LikeLike