

 My Comments: Last Monday, I posted comments from three people who said with conviction there was no reason to expect a market correction any time soon.
Today I have someone with no discernable name who says, also with conviction, that we’ll have one next year.
Here’s my take on this: if you are 60 years old or more, prepare for a correction. If you are less than 60 years of age, ignore all this, put your money to work and don’t worry about it.
Now, do you feel better?
November 7, 2017 from GoldSilverWorlds.com
The U.S. stock market is in amazing shape. Every day new all-time highs are set. This must be bullish, and investors should go all-in, right? Well, not that fast, at least not in our opinion. We see many signs that this rally is getting overextended, from an historical perspective. While we clearly said a year ago that we were bullish for this year, we did not see any stock market crash coming (a year ago). Right now, we are now on record with a forecast of a stock market crash in 2018, and it could take place as early as the first weeks / months of 2018.
So far, in all openness and transparency, our warning signals for a mini-stock market crash in November were invalidated. We were horribly wrong in terms of timing. However, we still believe there is a huge risk brewing for a mini-crash. The stronger the current rally, the stronger the fallback.
Yes, we do expect a strong mini-crash in the stock market in 2018, starting early 2018. Central banks will likely step in to avoid a similar chaos as in 2008/2009, so we don’t forecast the end of the financial system.
We do, however, believe a very stiff correction will take place, which potentially could bring a buying opportunity (to be confirmed at that point in time based on intermarket dynamics). More likely, however, we believe that money will rotate out of U.S. stocks into emerging markets. That is why we are very bullish emerging markets in 2018.
The first warning signs of a stock market crash
We published the following warning signs starting in August:
• Is Volatility Making A Higher Low Here?
• Volatility On The Rise As Expected. What’s Next For Stocks?
• Ignore This Series Of Volatility Warning Signs At Your Own Peril
• Volatility Hit Historic Lows This Week. Maximum Complacency Is Bearish!
But the number of concerning indicators is accumulating now. Yes, it may sound as foolish as it can be that right during a strong bull market rally InvestingHaven’s research team talks about concerning indicators. But let’s first deep-dive before you come to a conclusion.
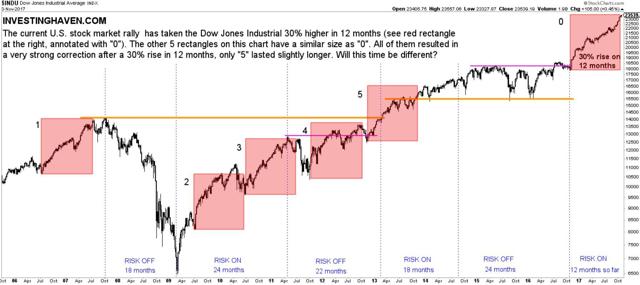
The Dow Jones Industrials chart is one of those concerning charts. The area indicated with “0” shows that the index has risen with more than 30% in 12 months without any meaningful correction. This rally may be amazing, but it is reaching a level never seen before in the past 12 years (including the 2007 rally and major top). All other instances of a 30% rise in 12 months are indicated on this chart (from 1 till 5):
• The 2013 rally (“5”) was as powerful as the current one, but resulted in a mini-crash just 3 months later.
• All other rallies (“1” till “4”) resulted in a strong correction or mini-crash within or right after the 12-month rally.
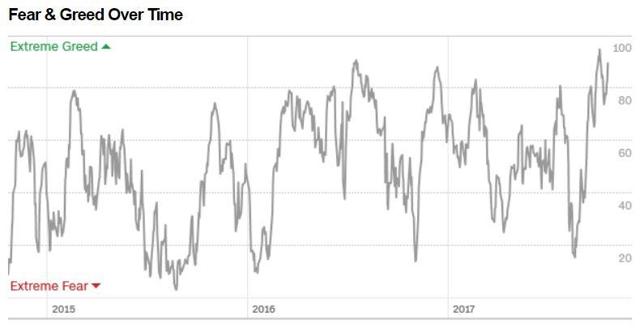
The current U.S. stock market sentiment shows extreme greed, according to the CNN Money fear & greed index.
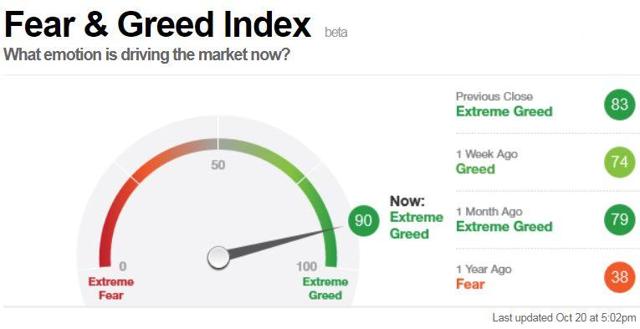
In the past 3 years, the Fear & Greed index reached similar levels of bullishness only twice. This bull run is overextended on the short-term time frame for sure.
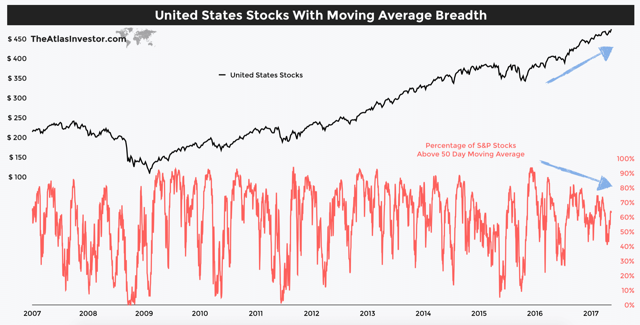
The stock market breadth, an indicator of strength of market internals, is suggesting that this rally is driven by a minority of stocks. As the broad indexes move higher, there are fewer stocks participating in the rally. Not a good sign.
4 charts suggesting a stock market crash in 2018 based on historical data
Let’s put the current stock bull market in historical context. As the charts speak for themselves, we believe they suggest a stock market crash is brewing, and it could start as early as the first days or weeks of 2018.
The first chart shows the strongest bull markets in the last 80 years. Visibly, the current bull market, which started in 2009, is now close to being the strongest ever. The current strong rally, which comes after an 8-year bull run, is a concerning factor, according to us.
Note from TK: To see these four charts and read the short accompanying text, GO HERE:
