

My Comments: Once again I’m grateful to Erik Conley for his insights on what to me might otherwise be something from ancient Greek translated into modern Arabic. That’s because I generally have no clue what the technical wizards in the world of money and investments are talking about.
But this one, maybe because the explanation is to coherent, makes sense. Whether it proves to be accurate remains to be seen. All the same, I encourage you to read it. Plus the numbers that appear on today’s calendar seem to resonate with his message.
By Erik Conley \ 23 FEB 2022 \ https://tinyurl.com/mrxhwbx4
Summary
- I calculate the odds of a negative return using Bayesian inference.
- The probability of any year being negative is 32%.
- This probability can be adjusted higher using Bayes theorem.
- A weak January, high inflation, Fed tightening, and decelerating growth in GDP and earnings can be factored into the equation.
I use Bayesian inference to calculate the odds of bear markets and recessions. The concept is simple, but the calculations can be tricky. We all use Bayesian inference in our daily lives without even thinking about it. All it takes is common sense. We start with a prior belief (the probability of something happening) and then we update it when new information comes to light.
For example, we know that it doesn’t rain most days. But if it rained last night and there are storm clouds present as we get ready to leave the house, Bayesian inference and common sense tell us to take an umbrella. The odds of it raining while storm clouds are present are much higher than they would be if the sun was shining.
Simple concept, tricky calculations
Here is an example of the way Bayesian inference is calculated. I won’t go into the details, but if you want to find out how this works and what all these numbers mean, there is a great YouTube video by Dr. Harper that explains it all. You can find it here.
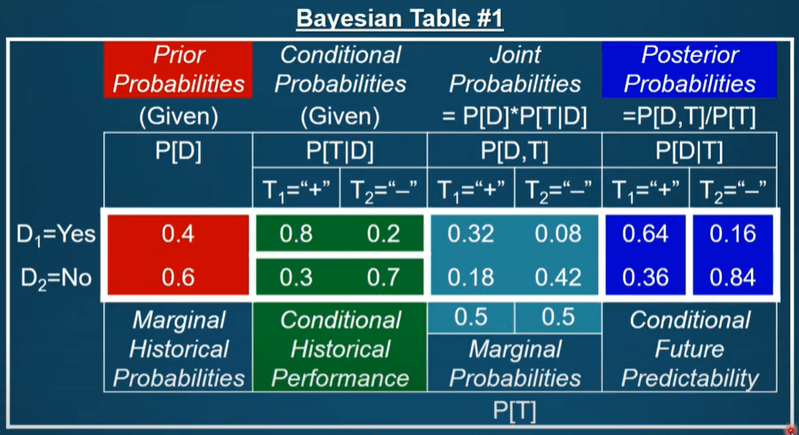
In my forecasting work I use a table like this one to do the calculations. I begin by asking a question. In this case the question is, “What are the odds that 2022 will end with a negative return?”
The first numbers I use are the prior probabilities for up years and down years going back to 1928. History shows these to be 68% up and 32% down. Said another way, it’s twice as likely that 2022 will be an up year than a down year. Next, I start adding in the new information that will update my prior probabilities. These are called conditional probabilities.
Condition 1. A weak January
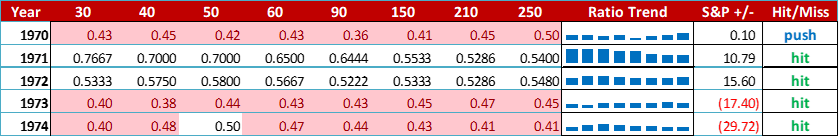
For this condition I look at the ratio of up days to down days over the first 30 trading days of the year. History shows that when there are more down days than up days, the odds of ending the year with a negative return are 88%.
This does not mean that 88% is the final answer to my question. I first have to consider the prior probability of 32% for a down year, and update it to reflect the 88% conditional probability. As a result of this update, the new odds are higher than the prior of 32%, but lower than the conditional of 88%.
Condition 2. High inflation
For this step I repeat the process by looking at the history of market outcomes during periods of high and rising inflation. As it turns out, rising inflation doesn’t become a factor unless it reaches 4% or higher. Although I think the odds are high that inflation will average 4% or more in 2022, I have to use all years with rising inflation in the calculations. Therefore, the impact is smaller than it was for a weak January, but it does raise the overall odds of a negative 2022.
Condition 3. Fed tightening
History shows that the stock market often rises during a Fed tightening period, but there is a big exception. If the Fed raises short-term rates high enough to create an inverted yield curve, the risk of a recession is higher. Markets anticipate recessions by several months, so the probability of having a down year with the Fed tightening is elevated.
Condition 4. Decelerating growth
We are past the peak for growth in both GDP and earnings. Barring a recession, the market can still go higher but the pace of gains is slower. We have seen this already over the last several months, and it will probably continue throughout the year.
The bottom line
After plugging in the priors, and the conditional probabilities, the odds of 2022 being a down year are now 66%. This number will change as new information becomes available.
Get your copy
I maintain an Excel spreadsheet with all of the up/down day ratios for each year. It includes the market return, and whether the ratio was a hit, miss, or push in a given year. You might find it useful in your own work. It’s free to anyone who requests it, and there is no advertising or selling of products or services. Just drop me a line at info@zeninvestor.org with the subject line “Ratio 30” and I will send you the link.
Here’s a preview of what it looks like.
Disclosure: I/we have no stock, option or similar derivative position in any of the companies mentioned, and no plans to initiate any such positions within the next 72 hours.
