

My Comments: I’ve had roughly 75% of my investable money in cash for some months now. I have no idea if I’m right or wrong, just that it seems to make sense as I think there’s risk out there I don’t want to confront.
These comments from a group I’ve known about for years tend to confirm my thinking. If you’re relatively young, and a long way from retirement, it may not make any difference, but if you’re like me and well into your retirement years, caution is the order of the day.
By Mott Capital Management / 14 JAN 22 / https://tinyurl.com/2p95phpc
The real pain trade is coming, and it will not be higher.
The S&P 500 is not earning any more today than it was expected to earn prior to the pandemic.
The one difference has been the Fed and the expansion of margin debt.
The 2018 meltdown scenario is not off the table.
The risk continues to grow for stocks, and what is now becoming evident is that earnings growth, although much higher than where it was at the end of 2019, has not been as speculator as made out to seem across the major indexes.
Consider that before the Covid pandemic hit, earnings estimates for the S&P 500 on February 14, 2020, for the year 2021 stood at $192.35 and $213.91 per share for 2022. Now, the virus and its uncertainty caused those estimates to plunge and eventually rebound as the economy learned to navigate the virus. But at the same time, when we fast forward to today, we find that earnings estimates are not much higher.
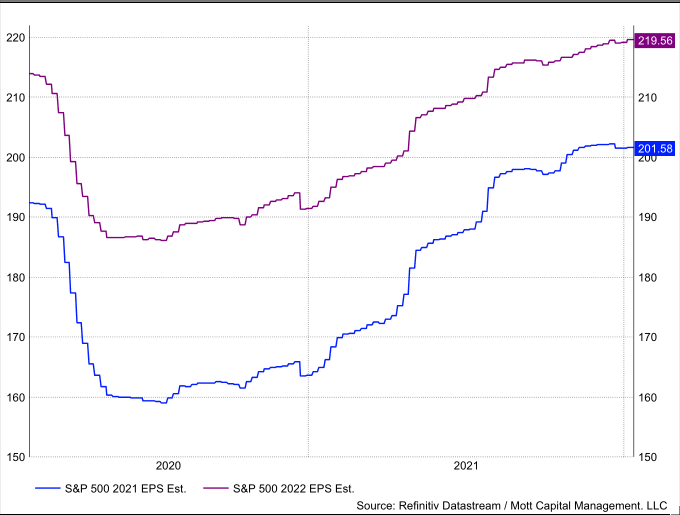
As of January 14, 2021, earnings estimates for 2021 stand at $201.58 and $219.56 for 2022, which is just slightly higher than what analysts had forecasted before the pandemic. But before the pandemic, the market was paying 17.5 times 2021 earnings estimates and 15.75 times 2022 earnings estimates. Now the market is paying 23.1 and 21.2 times earnings, respectively.

Of course, everyone will argue, well, rates are much lower now. Really? Are they lower now? Perhaps history will say differently. The 10-year yield on February 14, 2020, was lower than it is today. Back then, it was trading at 1.59%; today, it is around 1.7%.
Margin Debt
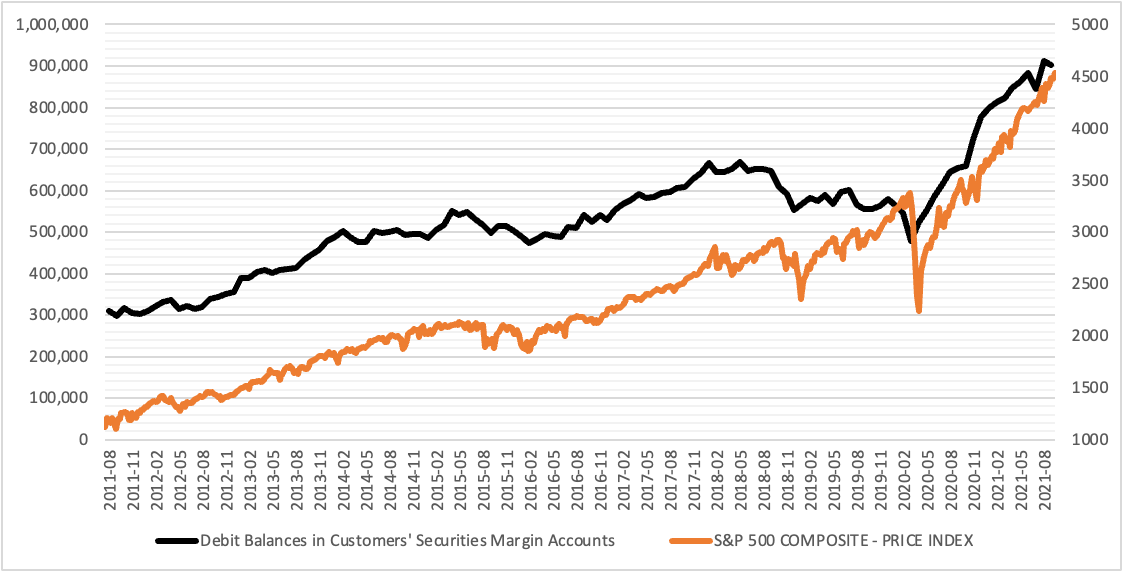
The real question is, why are investors paying higher multiples for stocks today than they did before the pandemic for essentially the same earnings? Oh well, if it isn’t interest rates, then it must be the Fed and all the QE. That certainly sounds more logical, as the easy monetary policy and accommodative financials have led to an expansion of margin debt investors have taken on.
In January 2020, FINRA margin levels stood at $561.8 billion. As of November 2021, FINRA margin debt stood at $918.6 billion or roughly 63.5% higher, an additional $356 billion in buying power. We see the direct relationship between the margin balances and the Fed’s balance sheet.
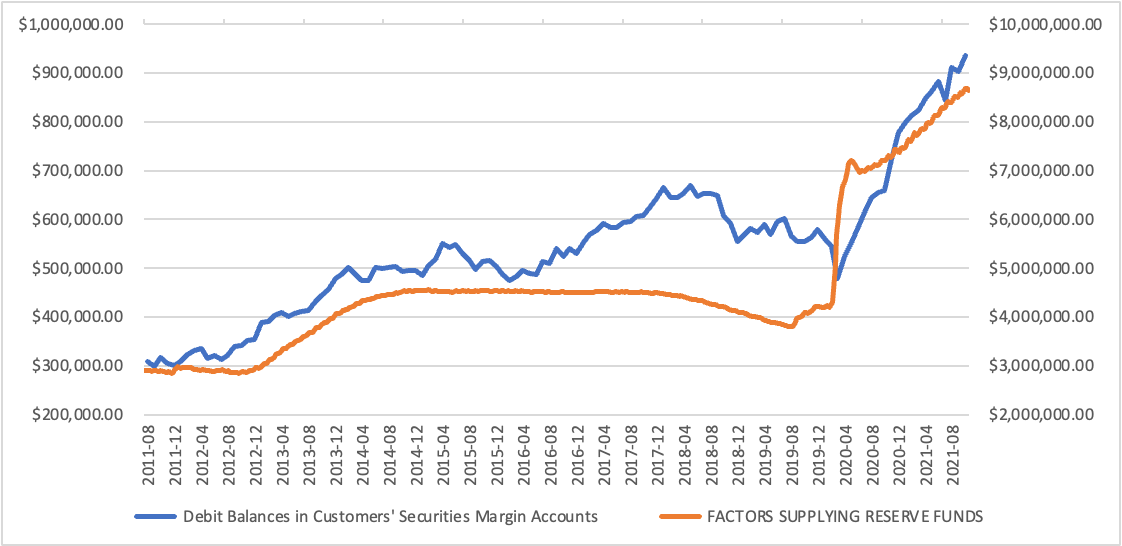
That expansion in margin balances results from the easy financial conditions created by QE, giving investors more access to cheap leverage. The data shows that when financial conditions tighten, margin balances decline, and when they ease, margin balances expand.
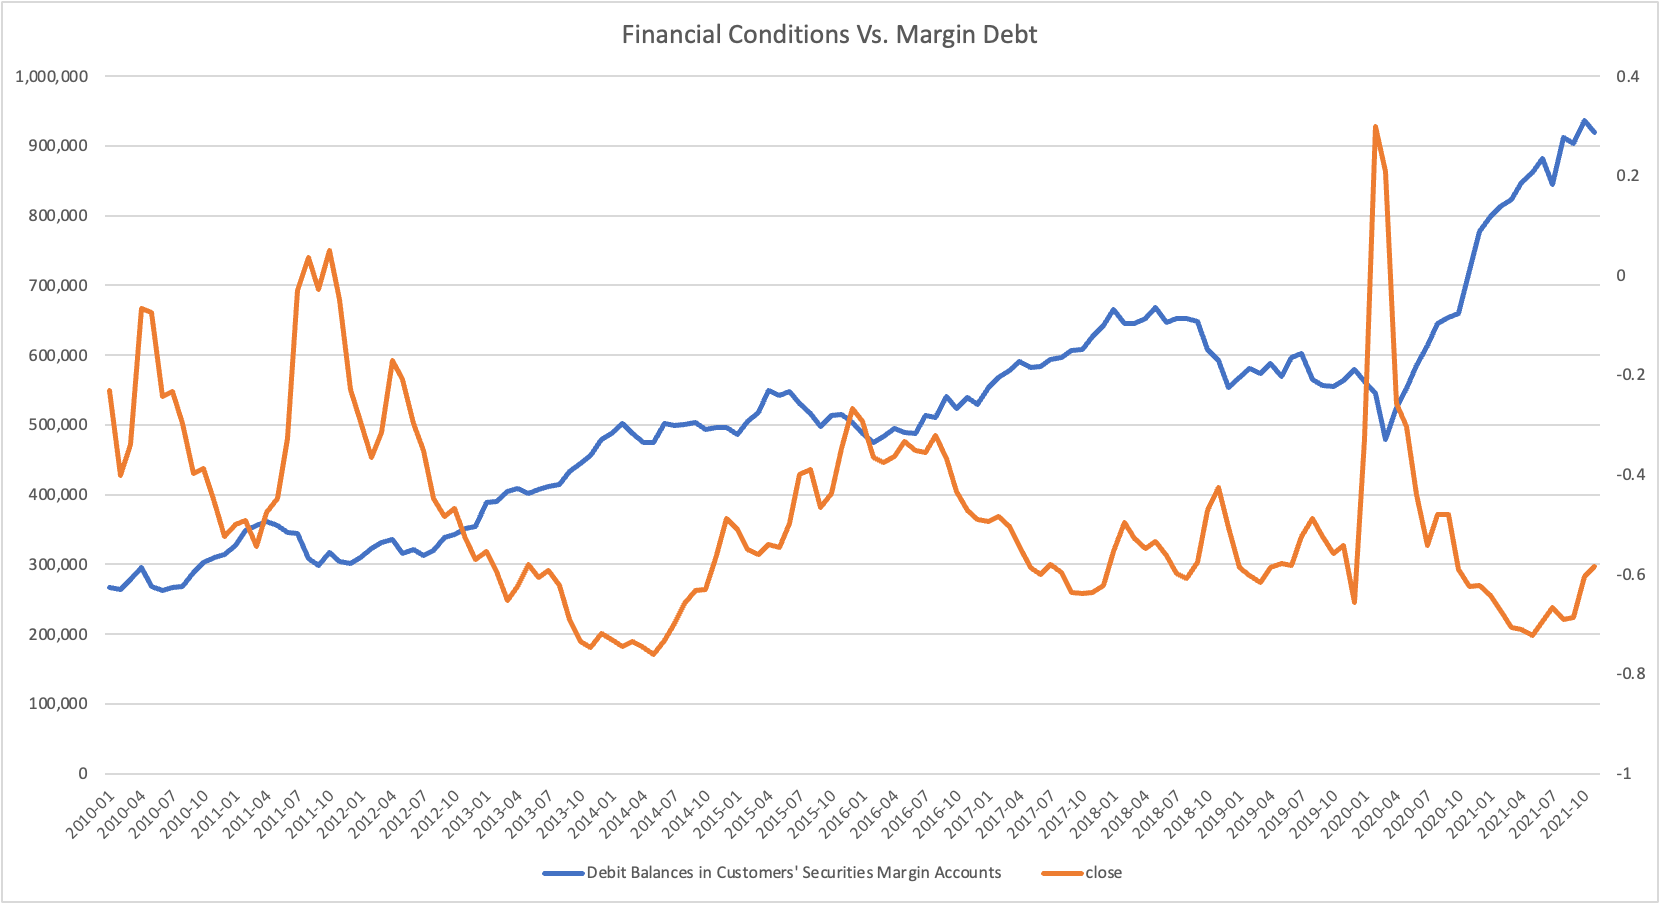
Additionally, in 2018 when the Fed was running off the balance sheet, financial conditions went through a period of tightening and easing. Ultimately, that led to a big draw in margin levels and a massive drawdown in the equity markets in the fourth quarter of 2018 as margin levels began to fall as conditions tightened.
A Repeat of 2018
Again, as I have repeatedly said, we are now in the same period. The only thing I hadn’t considered in my analysis prior to now, was that the Fed would begin to draw down the balance sheet so early in the tightening process. That means a repeat of the 2018 scenario is not off the table, and we may merely be in the very early stages of that sell-off process.
The Nasdaq Is Worse Off
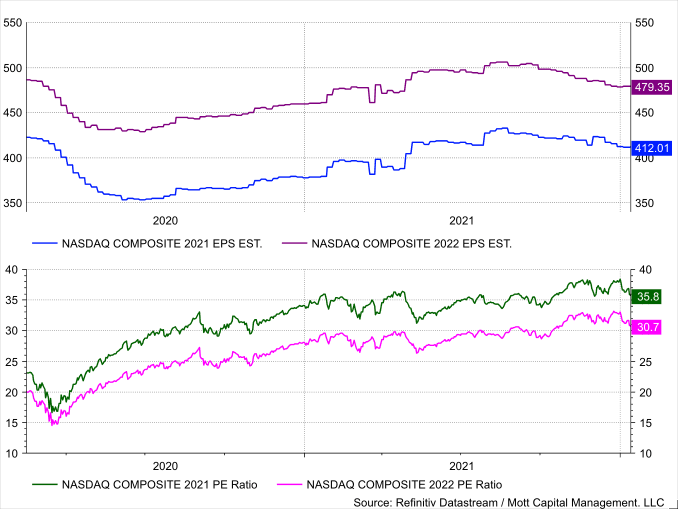
The earnings outlook for NASDAQ Composite is worse today than the forecast pre-pandemic. On February 14, 2020, the NASDAQ Composite was forecast to earn $422.50 in 2021 and $486.20 in 2022. Now, the NASDAQ is forecast to earn $412.01 and $479.35, especially. Except now, investors are paying 35.8 times 2021 earnings estimates and 30.7 times 2022 earnings estimates, vs. paying 23 times 2021 earnings estimates and 20.1 times 2022 earnings estimates.
So investors are paying more for earnings but getting less of them today.
Investors are overpaying for earnings today and getting about the same value as before the pandemic. The only difference is the Fed and the easy monetary accommodation that led to a massive increase in margin. But now, with the Fed going from uber dovish to a tightening hawk, that accommodation will vanish and with it all the excess margin in the market, like it did in 2018.
The pain trade is coming, and it will be lower, not higher like everyone has been brainwashed into believing.
Investing today is more complex than ever. With stocks rising and falling on very little news while doing the opposite of what seems logical. Reading the Markets helps readers cut through all the noise delivering stock ideas and market updates, looking for opportunities.
We use a repeated and detailed process of watching the fundamental trends, technical charts, and options trading data. The process helps isolate and determine where a stock, sector, or market may be heading over various time frames.
